Introduction
Constant sum questions let respondents allocate a numeric value to each item in a list, with all values required to sum to a total you define. This is useful for measuring relative preference or importance across items.

Constant sum questions let respondents allocate a numeric value to each item in a list, with all values required to sum to a total you define. This is useful for measuring relative preference or importance across items.
The value all entries must sum to.
Customizes the label shown next to the total value. Delete the text to remove the label entirely.
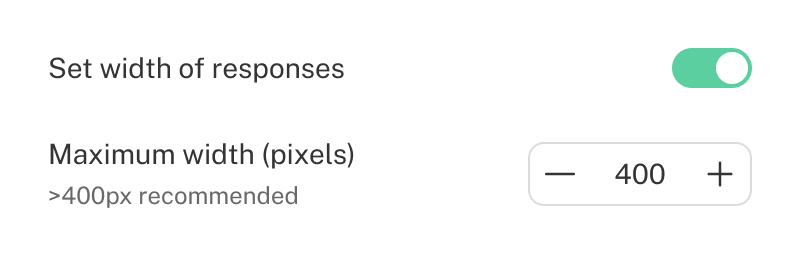
Sets the maximum width of the response area, which can help eliminate extra space when option labels are short. The width will never exceed either the value entered or the screen width, preserving mobile responsiveness. Note that this setting does not affect the mobile layout, which displays on screens narrower than 834px.